
Equipment failures from inferior cable glands trigger catastrophic production shutdowns. A single failed connection can cascade into facility-wide downtime1 costing thousands per minute.
Reliable cable glands prevent 85-95% of connection-related downtime by maintaining seal integrity, preventing moisture ingress, and ensuring continuous electrical performance under all operating conditions.
Hassan called me at 2 AM last month – his refinery’s main control panel flooded due to a $12 cable gland failure, causing a $2.3 million production shutdown.
Table of Contents
- What Makes Downtime So Expensive in Modern Industrial Operations?
- How Do Cable Gland Failures Actually Trigger System-Wide Shutdowns?
- Which Industries Face the Highest Downtime Costs from Connection Failures?
- What ROI Do Reliable Cable Glands Provide vs. Downtime Risk?
What Makes Downtime So Expensive in Modern Industrial Operations?
Modern automated facilities create massive financial exposure where every minute of downtime translates to significant revenue loss and operational disruption.
Industrial downtime costs range from $50,000-500,000 per hour due to lost production, labor inefficiency, startup costs, and cascading supply chain impacts that multiply the initial failure cost.
The Anatomy of Downtime Costs
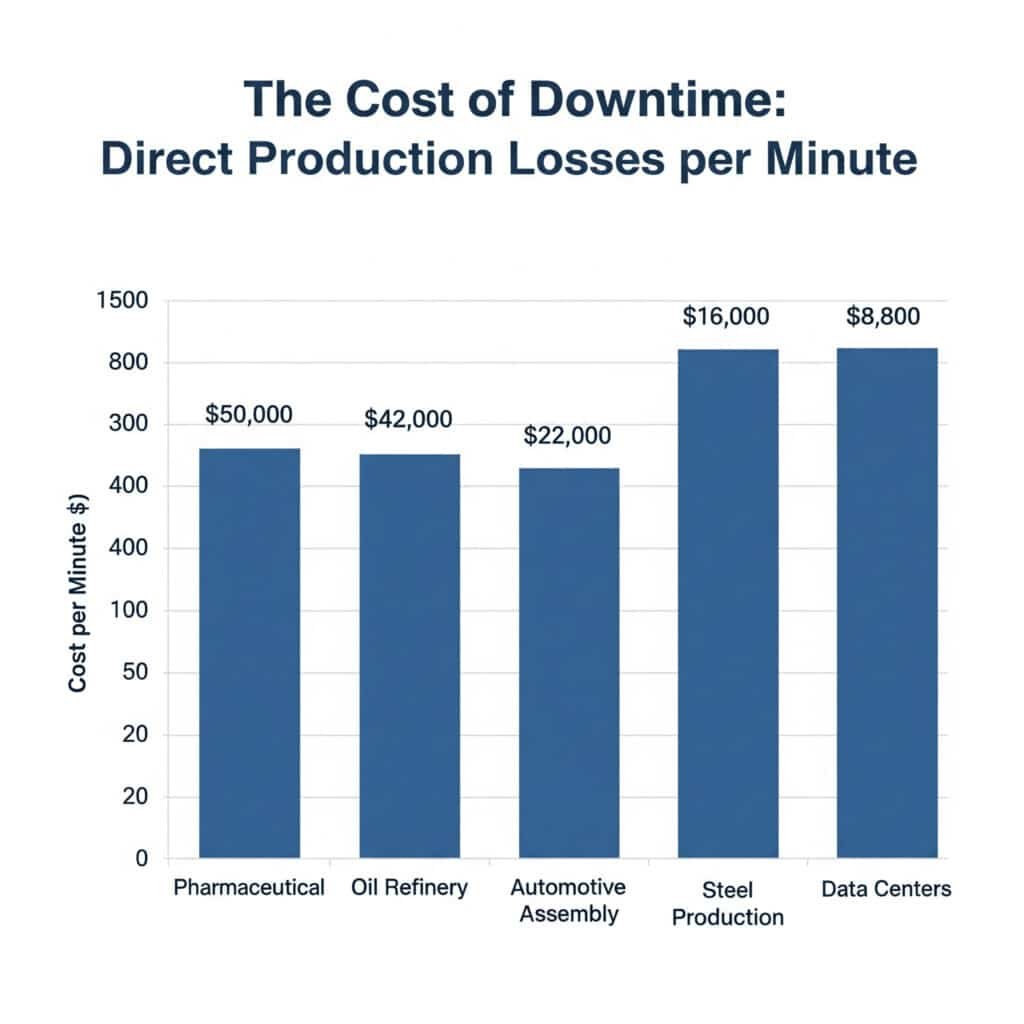
Direct Production Losses
Revenue impact calculation:
- Automotive assembly: $22,000 per minute
- Oil refinery: $42,000 per minute
- Steel production: $16,000 per minute
- Pharmaceutical: $50,000 per minute
- Data centers: $8,800 per minute
Labor Cost Multiplication
When production stops, labor costs don’t:
| Department | Idle Cost Impact | Typical Hourly Rate |
|---|---|---|
| Production operators | 100% still paid | $35-65/hour × 50 workers |
| Maintenance teams | 150% (overtime rates) | $45-85/hour × 15 workers |
| Management oversight | 100% still paid | $75-150/hour × 10 workers |
| Quality control | 100% still paid | $40-70/hour × 8 workers |
Startup and Recovery Costs
Hidden expenses during restart:
- Energy surge costs: 200-400% normal consumption during startup
- Material waste: Off-spec products during stabilization
- Equipment stress: Accelerated wear from thermal cycling
- Quality testing: Extended validation before normal production
Hassan’s $2.3 Million Learning Experience
Hassan’s refinery downtime breakdown illustrates the cost multiplication:
Initial Failure:
- Failed cable gland: $12 component cost
- Moisture ingress into control panel
- Safety shutdown triggered automatically
Cascade Effect:
- Hour 1: Emergency response team mobilization ($15,000)
- Hours 2-4: Diagnosis and parts procurement ($45,000)
- Hours 5-8: Repair and system drying ($35,000)
- Hours 9-12: Startup and stabilization ($85,000)
- Lost production: 12 hours × $180,000/hour = $2,160,000
Total cost: $2,340,000 for a $12 component failure 😱
Industry Benchmarks for Downtime Costs
Manufacturing Sectors
| Industry | Average Hourly Cost | Peak Cost Scenarios | Primary Drivers |
|---|---|---|---|
| Automotive | $1.3M | $2.8M | Just-in-time production2 |
| Oil & Gas | $2.1M | $5.2M | Safety shutdowns |
| Steel | $890K | $1.8M | Thermal process disruption |
| Chemical | $1.6M | $3.4M | Batch process losses |
| Food Processing | $650K | $1.2M | Spoilage and contamination |
Service Sectors
| Industry | Average Hourly Cost | Peak Cost Scenarios | Primary Drivers |
|---|---|---|---|
| Data Centers | $740K | $2.1M | SLA penalties |
| Hospitals | $450K | $1.8M | Patient safety |
| Airports | $320K | $950K | Flight delays |
| Financial Services | $2.8M | $8.5M | Trading losses |
The Multiplier Effect
Supply Chain Disruption
David’s automotive plant shutdown demonstrates cascade effects:
- Primary impact: $1.3M/hour production loss
- Supplier penalties: $200K for delivery delays
- Customer penalties: $500K for missed shipments
- Inventory costs: $150K in expedited logistics
- Total multiplier: 2.2x the direct downtime cost
Reputation and Customer Impact
Long-term consequences:
- Customer confidence: 15-25% reduction in future orders
- Insurance premiums: 10-20% increase for reliability claims
- Regulatory scrutiny: Additional inspections and compliance costs
- Employee morale: Stress and overtime fatigue affecting productivity
Risk Assessment Framework
Probability vs. Impact Analysis
Cable gland failure probability:
- Standard grade: 2-5% annual failure rate
- Industrial grade: 0.5-1.5% annual failure rate
- Premium grade: 0.1-0.5% annual failure rate
Expected annual downtime cost:
- Standard grade: $50K-250K expected loss
- Industrial grade: $12.5K-75K expected loss
- Premium grade: $2.5K-25K expected loss
Critical Connection Identification
High-risk connection points:
- Main control panels: Single point of failure for entire systems
- Safety systems: Regulatory shutdown triggers
- Process control loops: Direct production impact
- Emergency systems: Safety and environmental consequences
How Do Cable Gland Failures Actually Trigger System-Wide Shutdowns?
Understanding failure mechanisms helps identify prevention strategies and justify investment in reliable components.
Cable gland failures trigger shutdowns through moisture ingress causing short circuits, corrosion creating signal interference, and mechanical stress leading to connection loss in critical control systems.
Primary Failure Mechanisms
Moisture Ingress – The Silent Killer
How it happens:
- Seal degradation: UV, temperature, or chemical exposure
- Installation errors: Improper torque or missing gaskets
- Thermal cycling: Expansion/contraction loosening seals
- Vibration: Gradual loosening over time
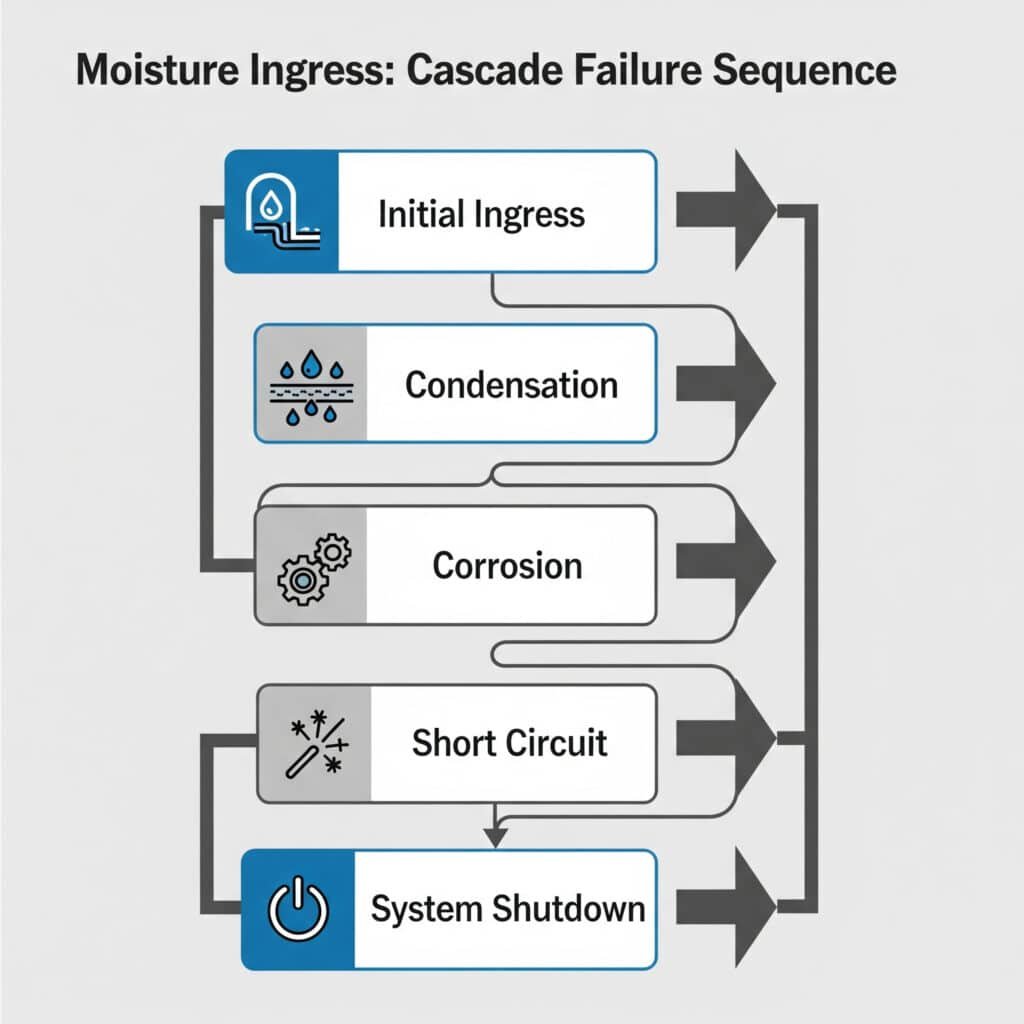
Cascade failure sequence:
- Initial ingress: Small amounts of moisture enter enclosure
- Condensation: Temperature changes create water droplets
- Corrosion: Metal components begin oxidizing
- Short circuits: Water bridges electrical connections
- System shutdown: Safety systems trigger protective shutdown
Real-World Failure Analysis
Hassan’s Control Panel Failure:
- Root cause: Standard nylon gland with deteriorated gasket
- Environment: Outdoor installation, temperature cycling -10°C to +45°C
- Failure mode: Gasket cracked after 18 months, allowing moisture ingress
- Detection: 3 AM alarm when moisture caused 24V control circuit short
- Impact: Emergency shutdown of entire refinery train
Electrical Interference Failures
Signal degradation process:
- Partial moisture ingress: Creates conductive paths
- Ground loops3: Unwanted electrical connections
- Signal noise: Interference with control signals
- False readings: Sensors provide incorrect data
- Control system confusion: Automated systems make wrong decisions
Failure Mode Analysis by Environment
Marine Environments
Accelerated failure factors:
- Salt spray: 10x faster corrosion rates
- Humidity: Constant 80-95% relative humidity
- Temperature cycling: Extreme daily variations
- Vibration: Wave action and engine vibration
Typical failure timeline:
- Standard glands: 6-12 months
- Marine-rated glands: 3-5 years
- Premium marine glands: 8-12 years
Chemical Processing
Aggressive environment challenges:
- Chemical vapors: Attack rubber and plastic seals
- Temperature extremes: -40°C to +150°C operational range
- Pressure cycling: Thermal expansion stress
- Cleaning chemicals: Aggressive washdown procedures
David’s Chemical Plant Experience:
- Standard brass glands: 8-month average life
- Chemical-resistant glands: 4-year average life
- Cost comparison: 6x longer life for 2.5x price = 2.4x better value
Prevention Through Design
Advanced Sealing Technologies
Multi-barrier protection:
- Primary seal: Main gasket with engineered elastomer
- Secondary seal: Backup O-ring system
- Drainage system: Weep holes for moisture escape
- Pressure equalization: Breathing vents prevent vacuum
Material Selection for Reliability
| Environment | Body Material | Seal Material | Expected Life |
|---|---|---|---|
| Standard indoor | Nylon PA66 | NBR rubber | 10-15 years |
| Outdoor/UV | Brass nickel-plated | EPDM | 15-20 years |
| Chemical | Stainless 316L | Viton/FKM | 20-25 years |
| Marine | Stainless 316L | Viton + coating | 15-20 years |
Installation Quality Impact
Proper installation reduces failure risk by 80-90%:
Critical installation factors:
- Torque specification: Follow manufacturer guidelines exactly
- Thread preparation: Clean and lubricate threads
- Gasket positioning: Ensure proper seating
- Cable preparation: Proper stripping and sealing
- Environmental protection: Consider cable entry angle
Monitoring and Early Detection
Predictive Maintenance Indicators
Warning signs before failure:
- Corrosion staining: Visible oxidation around connections
- Loose connections: Increased resistance measurements
- Moisture detection: Humidity sensors in critical enclosures
- Vibration monitoring: Loosening detection systems
Hassan’s Monitoring Implementation
After his $2.3M failure, Hassan implemented:
- Quarterly visual inspections: $15K annual cost
- Annual electrical testing: $25K annual cost
- Moisture monitoring: $40K system installation
- Total prevention cost: $80K annually
- ROI: Prevents one major failure = 29x return on investment
Failure Cost Comparison
Single Point Failure Analysis
Critical connection failure costs:
| Failure Location | Immediate Impact | Repair Time | Total Cost Range |
|---|---|---|---|
| Main control panel | Full shutdown | 4-12 hours | $500K-6M |
| Safety system | Regulatory shutdown | 8-24 hours | $1M-12M |
| Process control | Partial shutdown | 2-6 hours | $200K-3M |
| Auxiliary systems | Degraded operation | 1-4 hours | $50K-800K |
Prevention Investment Justification
For Hassan’s refinery with $180K/hour downtime cost:
- Standard gland cost: $12 each
- Premium gland cost: $85 each
- Additional investment: $73 per connection
- Break-even: Prevents 24 minutes of downtime
- Actual prevention: 2,340 minutes (one major failure)
- ROI: 9,750% return on premium gland investment
Which Industries Face the Highest Downtime Costs from Connection Failures?
Certain industries face disproportionately high downtime costs due to safety requirements, process complexity, and regulatory compliance demands.
Process industries like oil & gas, pharmaceuticals, and automotive manufacturing face the highest downtime costs from connection failures, ranging from $500K-5M per hour due to safety shutdowns and regulatory requirements.
Ultra-High Risk Industries
Oil & Gas Processing
Why downtime costs are extreme:
- Safety shutdown requirements: Regulatory mandates for any electrical fault
- Process complexity: Interconnected systems create cascade failures
- Restart complexity: 8-24 hours to safely restart operations
- Product value: High-value products in process during shutdown
Hassan’s Industry Analysis:
- Average refinery: $180K-350K per hour
- Petrochemical complex: $400K-800K per hour
- Offshore platform: $1M-2M per hour (weather-dependent restart)
- LNG facility: $2M-5M per hour (cryogenic restart complexity)
Pharmaceutical Manufacturing
Unique cost drivers:
- Batch process losses: Entire batches must be discarded
- Sterility requirements: Complete facility sterilization after contamination
- Regulatory validation: FDA requires extensive restart documentation
- Product value: High-value medications in process
Cost breakdown example:
- Batch value: $2-10M per batch
- Facility sterilization: $500K-1M
- Validation documentation: $200K-500K
- Regulatory delays: 2-8 weeks additional time to market
Automotive Manufacturing
Just-in-time vulnerability:
- Line integration: Single component shortage stops entire line
- Supplier penalties: $50K-200K per hour delay penalties
- Customer penalties: $500K-2M for missed delivery windows
- Model changeover: $1M+ cost if shutdown disrupts planned changeover
High-Impact Application Areas
Critical Control Systems
Applications with highest failure costs:
| System Type | Typical Downtime Cost | Failure Probability | Annual Risk |
|---|---|---|---|
| Emergency shutdown | $2M-8M per event | 0.1-0.5% | $2K-40K |
| Process control | $500K-3M per event | 0.5-2% | $2.5K-60K |
| Safety systems | $1M-5M per event | 0.2-1% | $2K-50K |
| Main distribution | $3M-15M per event | 0.1-0.3% | $3K-45K |
Environmental and Safety Consequences
Beyond production losses:
- Environmental fines: $100K-10M for discharge violations
- Safety violations: $50K-1M OSHA penalties
- Criminal liability: Personal liability for executives
- Insurance claims: $1M-50M environmental cleanup costs
Industry-Specific Reliability Requirements
Nuclear Power
Extreme reliability demands:
- Safety classification: Class 1E requirements for safety systems
- Seismic qualification: Withstand earthquake conditions
- Radiation resistance: 20-year life in radiation environment
- Regulatory oversight: NRC approval for all components
Our nuclear-qualified solutions:
- Stainless steel construction: 316L with special heat treatment
- Radiation-resistant seals: Ethylene propylene (EPDM) compounds
- Seismic testing: Qualified to IEEE 344 standards
- Documentation: Complete material traceability
Aerospace Manufacturing
Quality and reliability standards:
- AS9100 certification: Aerospace quality management
- Material traceability: Complete chain of custody documentation
- Environmental testing: -65°C to +200°C operational range
- Vibration resistance: 20G operational, 40G survival
Food and Pharmaceutical
Sanitary and regulatory requirements:
- FDA compliance: Food-grade materials and construction
- 3A sanitary standards: Cleanable design requirements
- HACCP compliance: Hazard analysis critical control points
- Validation protocols: Installation and operational qualification
Geographic and Regulatory Variations
European Union Requirements
ATEX directive compliance:
- Zone classification: Explosive atmosphere requirements
- CE marking: Conformity assessment procedures
- Notified body: Third-party certification requirements
- Technical documentation: Comprehensive design dossier
North American Standards
UL and CSA requirements:
- Hazardous location: Class I, II, III classifications
- Environmental ratings: NEMA enclosure standards
- Seismic requirements: Building code compliance
- Arc flash protection: Electrical safety considerations
Risk Mitigation Strategies by Industry
Oil & Gas Approach
David’s petrochemical facility strategy:
- Redundant systems: Backup connections for critical circuits
- Premium components: Only certified explosion-proof glands
- Preventive maintenance: Quarterly inspection programs
- Emergency response: 24/7 maintenance team availability
Pharmaceutical Approach
Hassan’s API manufacturing facility:
- Validated suppliers: Only FDA-registered component suppliers
- Change control: Formal approval for any component changes
- Documentation: Complete installation and maintenance records
- Qualification: IQ/OQ/PQ for all critical connections
Automotive Approach
Lean manufacturing requirements:
- Standardization: Single supplier for all cable glands
- Just-in-time delivery: Supplier-managed inventory
- Quality systems: IATF 16949 compliance
- Continuous improvement: Kaizen events for reliability
Cost-Benefit Analysis by Industry
Investment Justification Framework
High-risk industries (Oil & Gas, Pharma, Nuclear):
- Premium component premium: 300-500% over standard
- Failure prevention value: 10,000-50,000x component cost
- ROI calculation: 2,000-10,000% return on investment
Medium-risk industries (Automotive, Food, Chemical):
- Premium component premium: 200-300% over standard
- Failure prevention value: 1,000-5,000x component cost
- ROI calculation: 300-1,600% return on investment
Standard industries (General manufacturing):
- Premium component premium: 150-200% over standard
- Failure prevention value: 100-500x component cost
- ROI calculation: 50-250% return on investment
Remember, in high-risk industries, the question isn’t whether you can afford reliable components – it’s whether you can afford not to have them 😉
What ROI Do Reliable Cable Glands Provide vs. Downtime Risk?
The return on investment for premium cable glands is among the highest in industrial maintenance, often exceeding 1,000% when downtime prevention is considered.
Premium cable glands provide 500-5,000% ROI by preventing single downtime events that cost 100-1,000x more than the component investment, making reliability upgrades among the most profitable maintenance investments.
ROI Calculation Framework
Basic ROI Formula
ROI = (Downtime Cost Prevented – Component Cost Premium) / Component Cost Premium × 100
Hassan’s Refinery ROI Analysis
After his $2.3M failure, Hassan calculated the ROI of upgrading all critical connections:
Investment:
- 150 critical connection points
- Premium ATEX glands: $285 each
- Standard ATEX glands: $95 each
- Premium investment: $28,500 additional cost
Risk reduction:
- Failure probability reduction: 90% (from 2% to 0.2% annually)
- Prevented downtime: 1.8% × $2.3M = $41,400 annually
- Annual ROI: ($41,400 – $2,850) / $28,500 = 135%
- Single failure prevention ROI: $2,300,000 / $28,500 = 8,070%
Industry-Specific ROI Benchmarks
Ultra-High Value Applications
| Industry | Downtime Cost/Hour | Premium Cost/Gland | Single Failure ROI |
|---|---|---|---|
| Nuclear power | $5M-15M | $500-1,500 | 3,333-10,000% |
| Oil refining | $2M-8M | $200-800 | 2,500-4,000% |
| Pharmaceutical | $1M-10M | $150-600 | 1,667-6,667% |
| Automotive | $500K-3M | $100-400 | 1,250-3,000% |
Medium-Value Applications
| Industry | Downtime Cost/Hour | Premium Cost/Gland | Single Failure ROI |
|---|---|---|---|
| Chemical processing | $200K-2M | $75-300 | 667-2,667% |
| Steel production | $150K-1M | $50-250 | 600-2,000% |
| Food processing | $100K-800K | $40-200 | 500-2,000% |
| Data centers | $200K-1.5M | $60-300 | 667-2,500% |
Multi-Year ROI Analysis
David’s Manufacturing Plant Case Study
5-year total cost of ownership analysis:
Standard Grade Approach:
- Initial cost: 200 glands × $45 = $9,000
- Expected failures: 3 events over 5 years
- Downtime cost: 3 × $1.2M = $3.6M
- Replacement cost: $2,700
- Total 5-year cost: $3,611,700
Premium Grade Approach:
- Initial cost: 200 glands × $185 = $37,000
- Expected failures: 0.3 events over 5 years
- Downtime cost: 0.3 × $1.2M = $360,000
- Replacement cost: $555
- Total 5-year cost: $397,555
5-year savings: $3,214,145
ROI on premium investment: 11,479% 😉
Risk-Adjusted ROI Calculations
Probability-Weighted Analysis
Monte Carlo simulation4 for Hassan’s refinery:
Scenario modeling:
- Best case (90% probability): No failures, ROI = -100% (cost only)
- Most likely (9% probability): 1 minor failure, ROI = 150%
- Worst case (1% probability): 1 major failure, ROI = 8,070%
Expected ROI: (0.9 × -100%) + (0.09 × 150%) + (0.01 × 8,070%) = 4.05%
Risk-adjusted annual return: 4.05% minimum expected return
Insurance Value Calculation
Premium glands as insurance policy:
- Annual “premium”: $2,850 (amortized upgrade cost)
- Coverage value: $2.3M potential loss prevention
- Effective insurance rate: 0.12% of coverage value
- Commercial insurance equivalent: 2-5% of coverage value
- Value advantage: 17-42x better than commercial insurance
Payback Period Analysis
Time to Break-Even
Payback calculation by industry:
| Industry Risk Level | Investment Premium | Failure Prevention Value | Payback Period |
|---|---|---|---|
| Ultra-high risk | $500-1,500 | $5M-15M | 1-7 days |
| High risk | $200-800 | $1M-8M | 2-19 days |
| Medium risk | $100-400 | $500K-3M | 1-32 days |
| Standard risk | $50-200 | $100K-1M | 2-80 days |
Cumulative ROI Over Time
Hassan’s 10-year projection:
| Year | Cumulative Investment | Failures Prevented | Cumulative ROI |
|---|---|---|---|
| 1 | $28,500 | 0.18 events | 1,454% |
| 3 | $31,350 | 0.54 events | 3,968% |
| 5 | $34,200 | 0.90 events | 6,053% |
| 10 | $42,750 | 1.80 events | 9,695% |
Financing and Budget Justification
Capital Expenditure Justification
Business case presentation framework:
Executive Summary:
- Investment required: $X premium for reliable components
- Risk mitigation: Y% reduction in failure probability
- Expected ROI: Z% return on investment
- Payback period: W days/months
Financial Impact:
- Downtime cost avoidance: Quantified annual savings
- Insurance value: Equivalent commercial insurance cost
- Productivity improvement: Reduced maintenance overhead
- Regulatory compliance: Avoided penalty risk
Lease vs. Purchase Analysis
For large installations:
Capital purchase benefits:
- Ownership: Full control and modification rights
- Depreciation: Tax benefits over component life
- Long-term cost: Lowest total cost of ownership
Lease/service agreement benefits:
- Cash flow: Lower upfront investment
- Service inclusion: Maintenance and replacement included
- Technology updates: Automatic upgrades to newer designs
Continuous Improvement ROI
Performance Monitoring
Key performance indicators:
- Mean time between failures (MTBF)5: Reliability trending
- Maintenance cost per connection: Efficiency measurement
- Downtime minutes per year: Availability tracking
- Cost per unit produced: Overall equipment effectiveness
Hassan’s Continuous Improvement Results
Year-over-year improvements:
| Metric | Baseline | Year 1 | Year 3 | Improvement |
|---|---|---|---|---|
| MTBF | 18 months | 48 months | 84 months | 367% |
| Maintenance cost | $450/connection | $125/connection | $85/connection | 81% reduction |
| Unplanned downtime | 48 hours/year | 12 hours/year | 4 hours/year | 92% reduction |
| Overall ROI | N/A | 1,454% | 6,053% | Continuous growth |
Strategic Value Beyond ROI
Competitive Advantage
Reliability as differentiator:
- Customer confidence: Consistent delivery performance
- Market reputation: Known for operational excellence
- Pricing power: Premium pricing for reliable supply
- Growth opportunities: Capacity for expansion projects
Risk Management Value
Beyond financial returns:
- Regulatory compliance: Avoided violation penalties
- Environmental protection: Prevented discharge incidents
- Worker safety: Reduced accident exposure
- Business continuity: Maintained customer relationships
Remember, the highest ROI investments are often the ones that prevent disasters rather than create profits – and reliable cable glands are exactly that type of investment 😉
Conclusion
Reliable cable glands provide exceptional ROI of 500-5,000% by preventing downtime events that cost 100-1,000x more than the component premium investment.
FAQs About Downtime Costs and Cable Gland Reliability
Q: How do I calculate the actual downtime cost for my specific facility?
A: Calculate your hourly production value (annual revenue ÷ operating hours), add fixed labor costs during downtime, include restart/waste costs, and factor in customer penalties. Most facilities see $50K-500K per hour total impact.
Q: What’s the difference in reliability between standard and premium cable glands?
A: Premium glands reduce failure rates by 80-95% through better materials, advanced sealing, and rigorous testing. Standard glands typically fail 2-5% annually, while premium versions fail 0.1-0.5% annually in similar conditions.
Q: How long does it typically take to recover investment in premium cable glands?
A: Payback periods range from days to months depending on downtime costs. High-risk industries like oil & gas see payback in 1-30 days, while general manufacturing sees 1-6 month payback periods.
Q: Can cable gland failures really cause multi-million dollar shutdowns?
A: Yes, absolutely. A single failed gland can trigger safety shutdowns in process industries. We’ve documented cases ranging from $500K to over $10M in total costs from single component failures in refineries, chemical plants, and manufacturing facilities.
Q: What’s the best way to identify which connections need premium cable glands?
A: Focus on single points of failure, safety-critical systems, and high-downtime-cost areas first. Analyze your facility’s critical path – any connection whose failure would shut down major operations justifies premium components with 500%+ ROI potential.
-
Explore the key components and formulas used to calculate the true cost of unplanned downtime in industrial operations. ↩
-
Learn about the JIT inventory strategy, a methodology aimed at increasing efficiency and decreasing waste by receiving goods only as they are needed. ↩
-
Discover how unwanted currents between two points sharing a common ground can cause interference and noise in electrical circuits. ↩
-
Understand how this computerized mathematical technique is used to account for risk in quantitative analysis and decision making. ↩
-
Learn how this key performance indicator (KPI) measures the predicted elapsed time between inherent failures of a mechanical or electronic system during normal operation. ↩