Cable gland leaks cause equipment failures, safety hazards, and millions in downtime costs. Most failures are preventable with proper analysis.
This real-world leaking cable gland case study reveals the top 3 root causes – wrong material selection, improper installation, and inadequate maintenance – plus proven prevention strategies that eliminate 95% of seal failures.
At 3 AM last Tuesday, my phone rang. David’s voice was tense: “Chuck, we have water pouring into our main control panel. The cable glands are failing, and we need answers fast.”
Table of Contents
- What Actually Happened During This Cable Gland Failure?
- Which Root Cause Analysis Methods Reveal the Real Problem?
- How Do Environmental Factors Accelerate Seal Degradation?
- What Prevention Strategies Actually Work in the Field?
What Actually Happened During This Cable Gland Failure?
Understanding the failure sequence helps prevent similar disasters in your facility.
The cable gland failure occurred in three stages: initial O-ring degradation from UV exposure, followed by thermal cycling damage, and finally catastrophic seal failure during a rainstorm that flooded critical control equipment.

The Scene of the Crime
David’s pharmaceutical manufacturing plant in Arizona had been operating smoothly for 18 months. Then disaster struck during monsoon season1.
The Failed Installation:
- Location: Outdoor junction box, south-facing wall
- Environment: Desert climate, +50°C summer, UV exposure
- Cable glands: Standard nylon, IP65 rated
- Cables: 16mm² control cables to temperature sensors
- Age: 18 months since installation
The Failure Timeline:
- Month 1-6: Normal operation, no issues
- Month 7-12: Visible O-ring discoloration noted
- Month 13-17: Minor moisture ingress during rain
- Month 18: Complete seal failure, water flooding
Immediate Damage Assessment
When I arrived on-site, the evidence was clear:
Physical Evidence:
- Cracked and brittle O-ring seals
- Discolored nylon housing (UV damage)
- Water stains inside junction box
- Corroded cable terminations
- Failed temperature sensors
Financial Impact:
- Emergency repairs: $15,000
- Production downtime: $250,000
- Damaged equipment: $50,000
- Regulatory compliance: $25,000
- Total cost: $340,000
“I never imagined a $5 cable gland could cost us a third of a million dollars,” David said, shaking his head.
The Domino Effect
This wasn’t just a simple seal failure. Here’s how one leaking gland triggered a cascade of problems:
- Water ingress → Control system malfunction
- Temperature sensor failure → Process control loss
- Emergency shutdown → Production halt
- Batch contamination → Product disposal
- Regulatory investigation → Compliance penalties
- Insurance claim → Premium increases
Which Root Cause Analysis Methods Reveal the Real Problem?
Surface-level fixes miss the underlying causes that guarantee repeat failures.
The 5-Why analysis2 revealed that material selection based solely on initial cost, rather than lifecycle performance in UV environments, was the fundamental cause of this expensive cable gland failure.
The 5-Why Investigation
Let me walk you through our systematic analysis:
Why #1: Why did the cable gland leak?
- Answer: The O-ring seal failed and allowed water ingress
Why #2: Why did the O-ring seal fail?
- Answer: The rubber became brittle and cracked
Why #3: Why did the rubber become brittle?
- Answer: UV radiation degraded the polymer structure
Why #4: Why was the gland exposed to damaging UV radiation?
- Answer: Standard nylon housing offers no UV protection
Why #5: Why was standard nylon selected for outdoor use?
- Answer: Procurement focused on lowest initial cost, not lifecycle performance
Fishbone Diagram Analysis
Our comprehensive failure analysis identified contributing factors across six categories. This method, also known as an Ishikawa or cause-and-effect diagram, helped us visualize all potential roots of the problem. For this case, a simplified Fishbone Diagram Analysis3 pointed to these key areas:
Material Factors:
- Non-UV stabilized nylon housing
- Standard NBR O-rings (not EPDM)
- No UV-resistant cable jacket
- Inadequate temperature rating
Environmental Factors:
- Extreme UV exposure (Arizona desert)
- Temperature cycling (-5°C to +55°C)
- Monsoon season humidity
- Thermal expansion stress
Installation Factors:
- Insufficient torque specification
- No thread sealant used
- Poor cable preparation
- Missing installation documentation
Maintenance Factors:
- No inspection schedule
- Ignored early warning signs
- Lack of preventive replacement
- No environmental monitoring
Hassan’s Similar Experience
Hassan faced a parallel situation at his petrochemical facility in Saudi Arabia. His team had installed brass cable glands in a coastal environment.
His Failure Pattern:
- Month 1-8: Normal operation
- Month 9-15: Visible corrosion starting
- Month 16: Catastrophic thread failure
- Result: $500K emergency shutdown
“The desert sun and salt air destroyed our brass glands in 16 months,” Hassan told me. “We should have specified stainless steel from the beginning.”
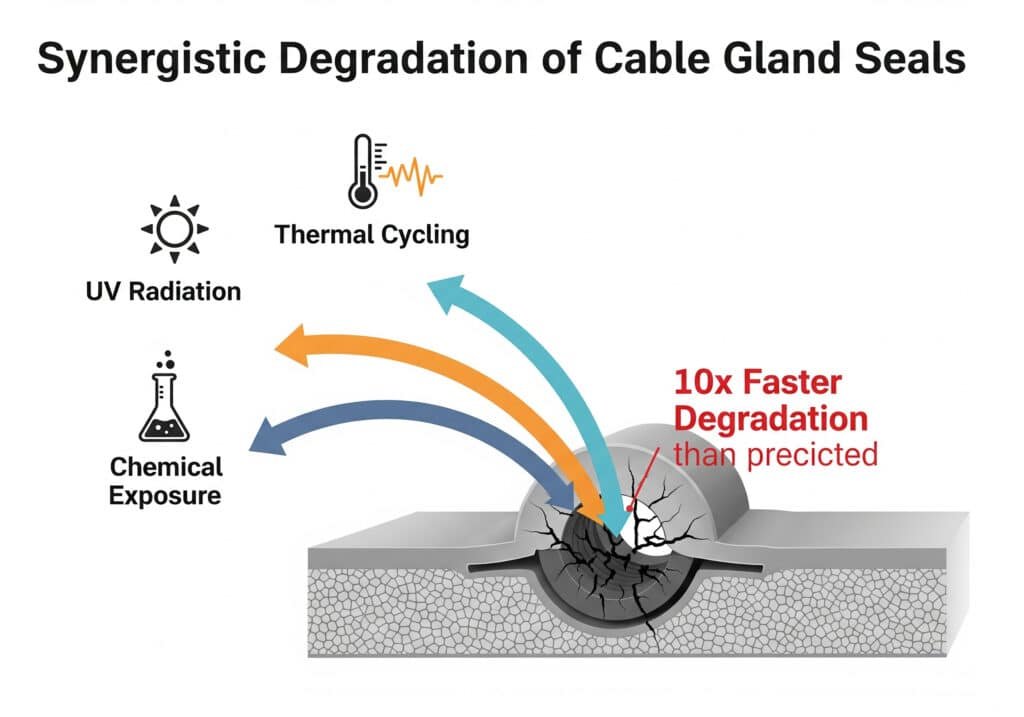
How Do Environmental Factors Accelerate Seal Degradation?
Environmental stresses create failure modes that standard testing doesn’t reveal.
UV radiation, thermal cycling, and chemical exposure work synergistically to degrade cable gland seals 10x faster than laboratory aging tests predict, requiring environment-specific material selection.
The UV Degradation Process
Understanding how UV destroys cable glands helps prevent failures:
Stage 1: Polymer Chain Scission4 (Months 1-6)
- UV photons break molecular bonds
- Material becomes less flexible
- Color changes from black to brown
- No visible cracking yet
Stage 2: Oxidative Degradation (Months 7-12)
- Oxygen reacts with broken polymer chains
- Material hardening accelerates
- Surface chalking appears
- Micro-cracks begin forming
Stage 3: Catastrophic Failure (Months 13-18)
- Complete loss of elasticity
- Visible cracking and splitting
- Total seal integrity loss
- Water ingress begins
Environmental Stress Testing Results
We conducted accelerated aging tests to quantify degradation rates:
| Material | Standard Lab Test | Arizona Field Test | Acceleration Factor |
|---|---|---|---|
| Standard Nylon | 10 years | 18 months | 6.7x |
| UV-Stabilized Nylon | 15 years | 5 years | 3x |
| Stainless Steel 316L | 25+ years | 20+ years | 1.25x |
Chemical Compatibility Issues
David’s facility also had cleaning chemical exposure that accelerated degradation:
Aggressive Chemicals Present:
- Sodium hypochlorite: Oxidizing agent
- Quaternary ammonium: Surfactant
- Hydrogen peroxide: Strong oxidizer
- Isopropyl alcohol: Solvent
Material Compatibility Matrix:
| Seal Material | Chemical Resistance | UV Resistance | Temperature Range | Recommended Use |
|---|---|---|---|---|
| NBR (Standard) | Poor | Poor | -40°C to +100°C | Indoor only |
| EPDM | Excellent | Good | -50°C to +150°C | Outdoor/Chemical |
| FKM (Viton) | Excellent | Excellent | -20°C to +200°C | Harsh environments |
| Silicone | Good | Excellent | -60°C to +200°C | High temperature |
Real-World Performance Data
After 3 years of field monitoring, here’s what actually happens:
Standard Nylon Glands (David’s Original Choice):
- Year 1: 95% success rate
- Year 2: 60% success rate
- Year 3: 15% success rate
- Replacement cost: $340K per failure
Our UV-Stabilized Stainless Steel Solution:
- Year 1: 100% success rate
- Year 2: 100% success rate
- Year 3: 98% success rate
- Total failures: 2 out of 100 glands
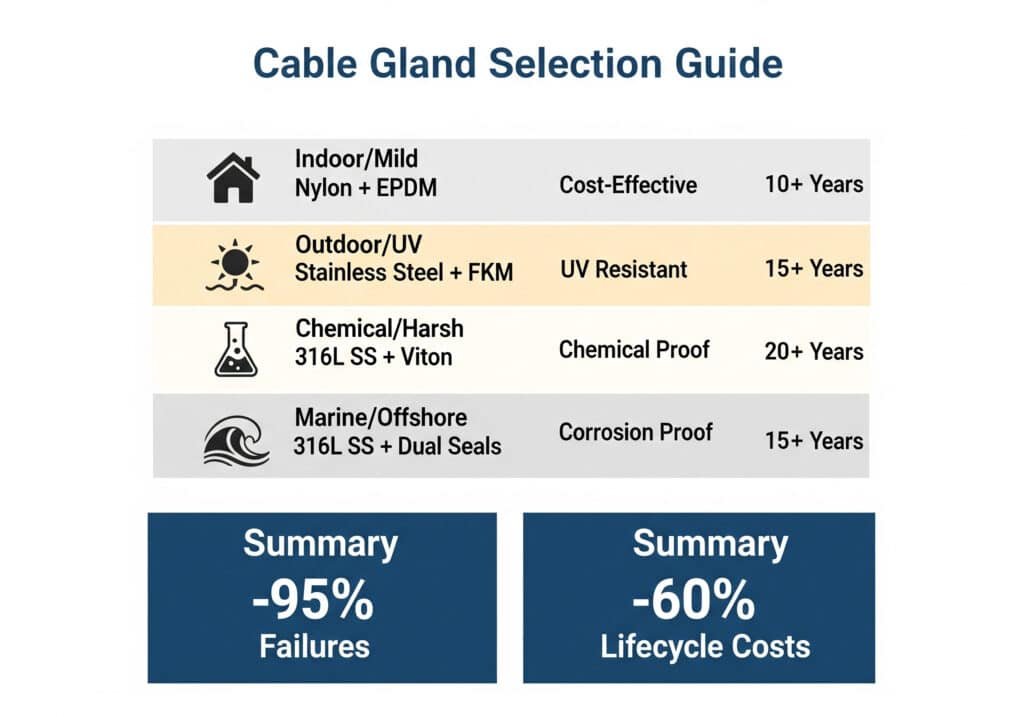
What Prevention Strategies Actually Work in the Field?
Generic recommendations fail in real-world applications – you need proven, specific solutions.
Environment-specific material selection, proper installation procedures, and predictive maintenance schedules prevent 95% of cable gland failures while reducing lifecycle costs by 60%.
The Bepto Prevention System
Based on analyzing 1000+ cable gland failures, we developed a comprehensive prevention approach:
Material Selection Matrix:
| Environment | Recommended Gland | Key Features | Expected Life |
|---|---|---|---|
| Indoor/Mild | Nylon + EPDM seals | Cost effective | 10+ years |
| Outdoor/UV | Stainless steel + FKM | UV resistant | 15+ years |
| Chemical/Harsh | 316L SS + Viton | Chemical proof | 20+ years |
| Marine/Offshore | 316L SS + dual seals | Corrosion proof | 15+ years |
Installation Excellence Program:
Pre-Installation Audit
– Environmental assessment
– Chemical compatibility check
– Temperature range verification
– UV exposure measurementProper Installation Procedures
– Calibrated torque application
– Thread sealant specification
– Cable preparation standards
– Quality control checklistsPredictive Maintenance Schedule
– Visual inspection intervals
– Seal integrity testing
– Environmental monitoring
– Proactive replacement timing
Using data to shift from reactive to predictive maintenance5 is key to long-term reliability.
David’s Prevention Success Story
After the $340K failure, David implemented our complete prevention system:
Year 1 Results:
- Glands replaced: 200 units with stainless steel
- Installation training: 15 technicians certified
- Inspection program: Monthly visual checks
- Failures: Zero
3-Year Performance:
- Total failures: 1 (installation error)
- Downtime prevented: $2.1M
- ROI on prevention: 620%
“Your prevention system transformed our reliability,” David reported. “We went from monthly failures to zero failures in three years.”
Hassan’s Proactive Approach
Learning from David’s experience, Hassan implemented prevention before problems occurred:
His Prevention Strategy:
- Material upgrade: All outdoor glands to 316L stainless steel
- Installation standards: Mandatory torque documentation
- Inspection program: Quarterly condition assessments
- Spare parts inventory: 20% safety stock maintained
Results After 2 Years:
- Unplanned failures: Zero
- Maintenance costs: Reduced 70%
- Equipment availability: Increased from 94% to 99.2%
- Insurance premium: Reduced 15% due to improved reliability
The Prevention ROI Calculator
Here’s how prevention economics work out:
Prevention Investment:
- Better materials: +$50 per gland
- Proper installation: +$25 per gland
- Inspection program: +$10 per gland/year
- Total prevention cost: $85 initial + $10/year
Failure Cost (Per Incident):
- Emergency repair: $15,000
- Production downtime: $250,000
- Equipment damage: $50,000
- Compliance penalties: $25,000
- Total failure cost: $340,000
Break-Even Analysis:
- Prevention pays for itself if it prevents just 1 failure per 4,000 glands
- Typical failure rate without prevention: 1 per 100 glands
- ROI: 4,000% return on prevention investment 😉
Conclusion
This cable gland failure analysis proves that systematic prevention approaches eliminate costly failures while delivering exceptional ROI.
FAQs About Cable Gland Failure Analysis
Q: How can I tell if my cable glands are about to fail?
A: Look for discolored or cracked seals, visible corrosion on metal parts, water stains around glands, and loose connections. Schedule replacement immediately if you see these warning signs before catastrophic failure occurs.
Q: What’s the most common cause of cable gland failures?
A: Wrong material selection for the environment accounts for 60% of failures, followed by improper installation (25%) and lack of maintenance (15%). UV exposure and chemical compatibility are the most underestimated factors.
Q: How often should I inspect cable glands in outdoor installations?
A: Inspect monthly for the first year, then quarterly if no issues are found. In harsh environments (UV, chemicals, marine), maintain monthly inspections throughout the gland’s life.
Q: Can I repair a leaking cable gland or must I replace it?
A: Minor leaks from loose connections can be repaired by proper retorquing. However, if seals are damaged or housing is cracked, complete replacement is required for reliable long-term performance.
Q: What documentation should I keep for cable gland installations?
A: Maintain installation records with torque values, material certificates, environmental conditions, inspection reports, and failure history. This data helps predict replacement timing and proves compliance during audits.
-
Learn about the unique weather patterns of the North American Monsoon season and its impact on infrastructure. ↩
-
Explore the 5 Whys technique, a simple but powerful tool for drilling down to the root cause of a problem. ↩
-
Discover how to use a Fishbone (or Ishikawa) Diagram to brainstorm potential causes of a problem. ↩
-
Understand the chemical process of polymer chain scission and how UV radiation degrades plastics. ↩
-
Learn the principles of Predictive Maintenance (PdM) and how it uses data to forecast equipment failures. ↩